
About
Overview
The University of Western Australia (UWA) has deployed surface wave buoys at locations around the Western Australian coastline to complement the existing observations collected by WA Department of Transport. Accurate observations of surface waves are required to verify and improve marine forecasts, inform marine operations and recreation, and form the basis for an improved understanding of ocean and coastal processes.
Currently, UWA operates a number of moored and drifting wave buoys. Presently there are two types of wave buoys deployed– the Datawell Directional Waverider 4 and the Sofar Ocean Technologies Spotter buoy. The cost of the wave buoys and their operation is covered through research grants and partnerships, including by/with:
- The Wave Energy Research Centre
- Integrated Marine Observing System
- UWA Oceanworks
- Aqualink
- Minderoo Foundation
This website has been designed to display the real-time data collected by these surface wave buoys and also to allow download of all archived data.
Data Description and Analysis
Surface wave buoys measure their motion at the water surface due to the waves using an accelerometer and/or GPS. The motions (in both the vertical and horizontal directions) are typically recorded approximately twice a second for a period of 30 to 60 minutes with these data then used to calculate statistics that attempt to represent the wave conditions over this time period. Over a 30 or 60 minute analysis period, there will be waves of many different sizes, of differing periods (the time between successive wave crests) and coming from different directions. To derive parameters that attempt to statistically describe the wave field, the buoy motions are processed using spectral analysis. The most common parameters resulting from this spectral analysis are the:
- Significant wave height (Hs) which roughly equates to the average of the largest one-third of the waves recorded in a given analysis period.
- Peak period (Tp) and peak direction (Dp) which are the most commonly occurring period and direction of the waves recorded in a given analysis time period (note that for waves and wind the convention is that the direction reported is the direction from).
- Mean period (Tm) and direction (Dm) which are the energy-weighted average wave period and direction.
- Peak and mean directional spreading which are an indication of how variable the wave directions are. If the directional spreading is small most waves are approaching from the peak/mean direction.
Additional parameters measured by some of the buoys include wind speed and direction as well as surface and bottom water temperature. The Sofar Spotter buoys provide an estimate of the wind speed and direction based on the buoy’s measurement of the short period wind waves (see a more detailed description here). Surface temperatures are recorded by both Datawell and Sofar buoys via a thermistor mounted to the wave buoy hull. Finally, simultaneous surface and bottom temperatures are recorded by Sofar Smart Moorings, which include a surface (~1 m below surface) and near bottom (~1 to 5 m above bottom) temperature sensor incorporated into the mooring.
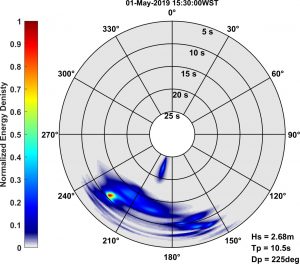
The above parameters are calculated on-board the buoys and transmitted at 30 minute to 2 hour intervals via 4G or Iriduium satellite internet. Based on the needs of the supporting project (and data transmission budget) some buoys also transmit back more detailed output from the spectral analysis which allows us to calculate (and show on the website) what is called the two-dimensional spectrum (calculated using the maximum entropy estimation method following Lygre and Krogstad, 1986). The two-dimensional spectrum is useful as it allows you to visualize the distribution of wave energy across both period and directional space. In the below example of a two-dimensional spectrum from Torbay near Albany, you can see three distinct regions of wave energy representing different sources, each with separate periods and directions. First, the most energy (red/yellow areas) is arriving from the southwest and has a period of about 11 seconds, these are the dominant conditions at the site when these data were recorded. Second, you can see a patch of energy between 20 and 25 seconds from the south-southwest. This very long period energy is indicative of a new swell arriving from a distant storm in the Southern Ocean. Finally, you can see energy with periods of 10 seconds and less from the south-southeast. The short period of these waves indicates they were mostly likely generated by local winds.
Quality control
Once the data is received by a server at UWA it is run through an automated quality control process to try and identify and remove any bad measurements (for example caused by temporary submergence of a buoy). The automated quality control is completed following the tests detailed in the QARTOD manual for surface waves.
Usage and Data Acquisition
You are welcome to download data the real-time and archived data (by selecting the date range and then clicking ‘export data’).
For the Tantabiddi, Torbay East, Torbay East, and Goodrich Bank buoys, you are free to use these data under a Creative Common license (CC BY 4.0) by acknolwedgement of both the University of Western Australia and the Integrated Marine Observing System (IMOS). Please also acknowledge the source of the material in this format: Data was sourced from Australia’s Integrated Marine Observing System (IMOS) – IMOS is enabled by the National Collaborative Research Infrastructure Strategy (NCRIS).
For the Bundegi, Tantabiddi (Aqualink) and Coral Bay (Aqualink) data, you are free to use these data under a Creative Common license (CC BY 4.0) by acknolwedgement of the University of Western Australia, Minderoo Foundation – Flourishing Oceans, and Aqualink.
For the Busselton Jetty data, you are free to use these data under a Creative Common license (CC BY 4.0) by acknolwedgement of both the University of Western Australia and the Busselton Jetty Environment Foundation.
For Yanchep Lagoon, Quinns Beach, and Quinns Dog Beach, you are free to use these data under a Creative Common license (CC BY 4.0) by acknolwedgement of both the University of Western Australia and the City of Wanneroo.
For all other buoys, you are free to use these data under a Creative Common license (CC BY 4.0) by acknolwedgement of the University of Western Australia.
We value your feedback: please let us know how you are using this wave data and if you have suggestions on how we can improve things.
This work is supported by:


![]()
![]()